
NZ’s property market mapped: ideal for visual beginners
CoreLogic NZ’s latest ‘Mapping the Market’ (June 2019) report has just been released, using location analytics and geospatial expertise to give visual learners a better understanding of New Zealand’s property market. Download at: Mapping the Market.
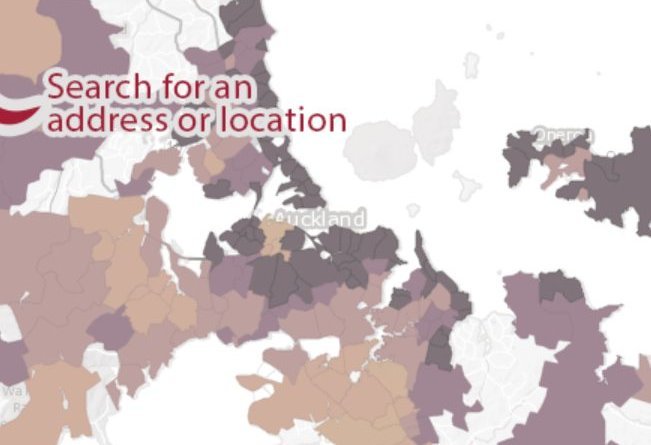
The constantly changing dynamics of New Zealand’s property market means that many would-be homeowners find it challenging to understand which suburbs currently match their home-buying budgets, but as CoreLogic senior economist Kelvin Davidson explains: “Like the saying goes: sometimes, a picture really can paint a thousand words. This updated visualisation tool uses GIS technology (and millions of data-points in the background) to deliver an easy to interpret explanation of the current property market. Click on a particular suburb anywhere in NZ and instantly see its current median property value.”
“It’s ideal for discovering other suburbs that may have previously been excluded from a homebuyer’s frame of reference. We used colour-blocking to show median values of one area relative to their surrounds…basically, anything dark purple means the suburb median is high for that particular market – in the case of Auckland, roughly $1.3m+. By contrast, the light orange sections show where you can still score property for much lower prices. It’s very easy to see which local suburbs sit within a particular budget”, Mr Davidson comments.
The Mapping the Market tool also provides a five-year snapshot, comparing median values in June 2014 to June 2019. It provides great visual insights into how the value of property has shifted over time: “To fully appreciate how hindsight is indeed a wonderful thing, you only have to click between the various suburbs and mapped visuals to see the value movements across suburbs in any major city”, Davidson remarks.
Complementing the visual demonstration, the smart map also provides key market commentary from the CoreLogic research team, with data highlights and trends provided for each major city. It’s not just the big cities, however – users can easily focus in on any part of the country they want. View here: Mapping the Market
Source: Core Logic